
Snapchat Political Ad Analysis
Introduction
Using data provided by Snapchat on political ads, found here: https://snap.com/en-US/political-ads. The purpose of this project is to predict the number of impressions (an impression is a click) an ad receives based on the features in the dataset in the form of regression. Then using the predictions of this model we test its fairness by testing against a Demographics Parity.
Baseline Model
For the Baseline model, I did not change any of the features from the given dataset. There are 25 features total, 1 is quantitative, 2 are ordinal, and 22 are nominal. The dataset is split into a training set and a test set, where the test set consists of 25% of the data, I do this to check for overfitting. The training set is used to run through a Pipeline that imputes 0 for null values and one hot encodes the categorical data. The Pipeline uses Linear Regression as its estimator to predict the Impressions. The score that I ended up with for the baseline model was: -54668990075092.12, and the RMSE is 1107918940513.30. I ran the baseline model 100 times and graphed it out and the results are displayed in Graph#1. The Baseline Model performed terribly because we did not remove any of the correlated values in each column, and some of the features that could be quantitative such as StartDate and EndDate are not being fully used.

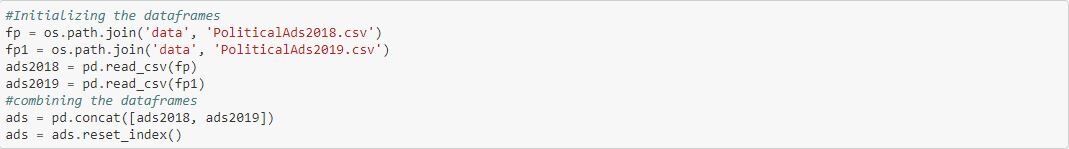
Initializing and combining political ad data from 2018 and 2019

Clean out unnecessary features such as ‘ADID’ and ‘CreativeURL’ and turn ‘Impressions’ into our y-values

Creating the categorical columns and numerical columns

Creating pipeline that takes in categorical data which imputes values, and one hot encodes the data. Then combines the categorical and quantitative features. Finally I run linear regression on the new dataset features.

Splitting the Dataset into a training set and test set

Getting the score for the baseline model, which is terrible

The root mean square error of the baseline model, which is also terrible
Final Model
As you can see the baseline model is far from good, so I looked to do some more feature engineering so that we can get a better score and Root Mean Square Error.
Initializing and combining political ad data from 2018 and 2019

Getting the median from each year to use to later normalize the data

Converting StartDate and EndDate to datetime object

Using the median to normalize the data because 2018 has much higher spending costs due to midterms